Recognition
Independent signals of analytical, visual, and storytelling quality.
2× Tableau Viz of the Day
Recognized by Tableau Public for exceptional visual analysis and storytelling.
DataDNA Winner
Winner of the Onyx DataDNA September 2024 analytics challenge.
DataDNA Runner-up
Runner-up recognition for healthcare analytics and business storytellings in April 2025 & June 2026.
2026 Tableau Conference Featured
A featured portfolio project within the global Tableau community.
About
Business-minded analytics with an auditor's instinct for accuracy
I am a Data and Business Intelligence Analyst with an MBA and more than two years of experience turning complex, messy data into decision-ready reporting.
My work combines SQL, Python, Tableau, Power BI, data modelling, and automation to solve practical business problems such as revenue leakage, customer churn, operational monitoring, data-quality gaps, and manual reporting bottlenecks.
I bring a finance and accounting perspective to analytics: every metric should reconcile, every dashboard should answer a business question, and every insight should lead to a clear action.
SaaSFinTechHealthcareNonprofitOperationsProduct Analytics
Analytics
SQL · Python · Pandas · Statistics · Segmentation
Business Intelligence
Tableau · Power BI · Excel · KPI Design · Executive Dashboards · Data Storytelling
Data Engineering
ETL Pipelines · SQL Server · PostgreSQL · MySQL · Data Validation · Reporting Automation
Domain Expertise
Revenue Analytics · Churn · Reconciliation · Process Improvement · Stakeholder Communication
Selected Projects
Business problems solved end to end
Each case study connects the business challenge, analytical approach, measurable impact, and technical implementation.
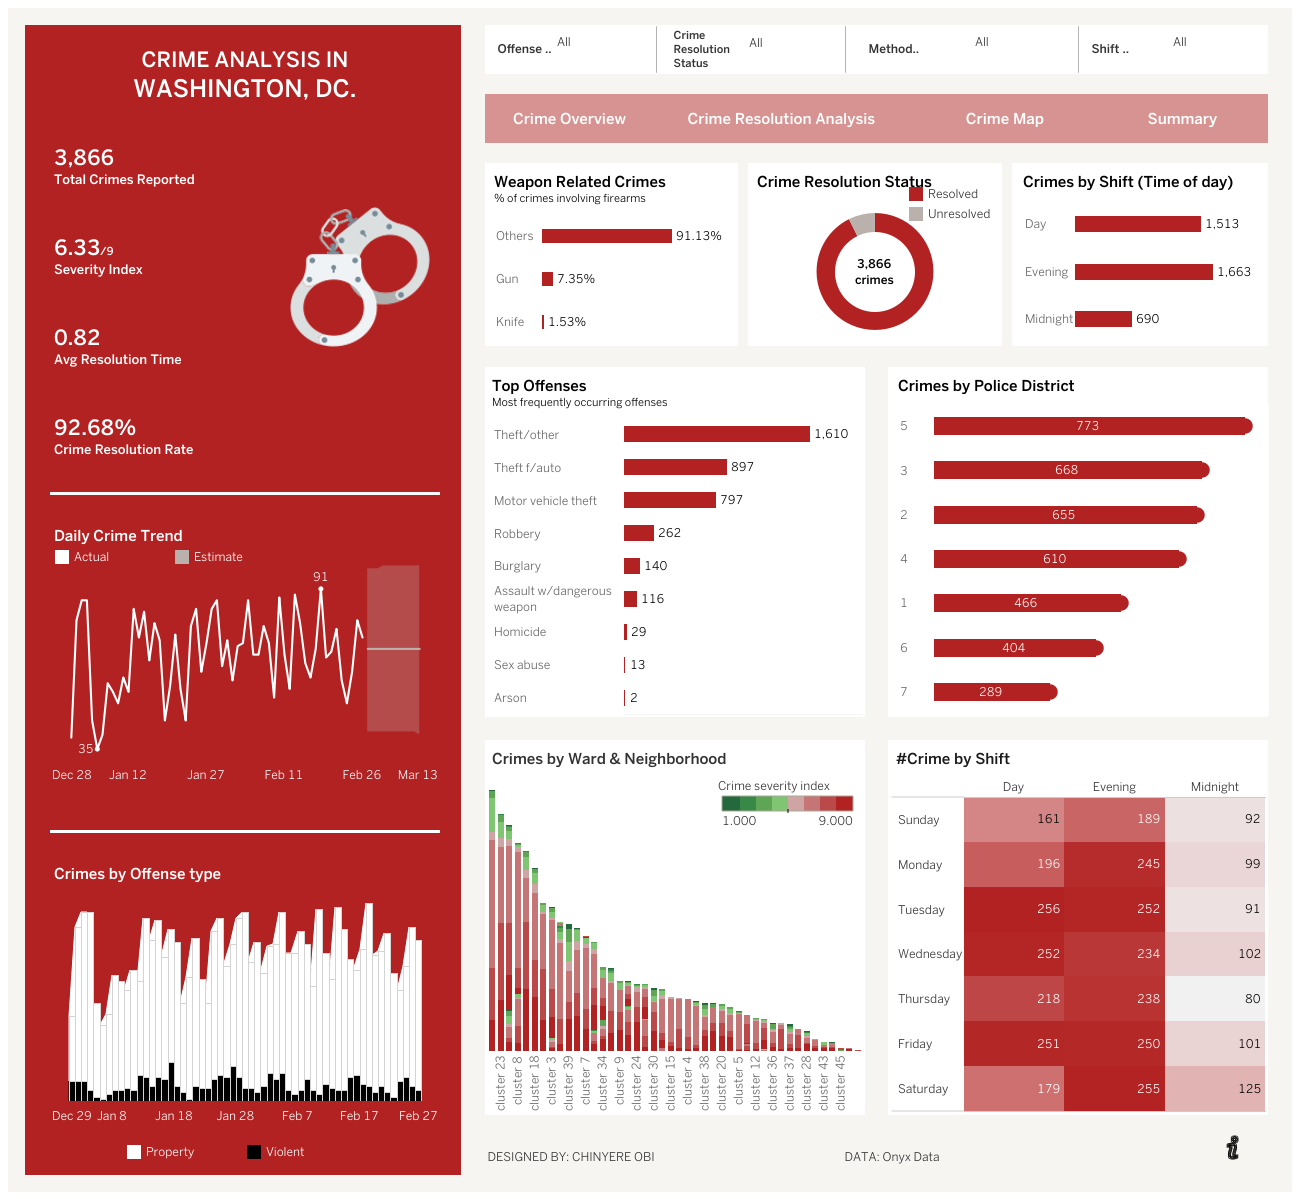
Revenue Analytics
Revenue Reconciliation & Data Quality System
- Challenge
- Finance could not reliably reconcile product access against billing records.
- Approach
- Built a SQL validation and exception-classification workflow.
- Impact
- $260K+ in annual revenue exposure identified.

Predictive Analytics
Customer Churn Analysis & Prediction
- Challenge
- Retention teams lacked a reliable way to identify customers likely to churn.
- Approach
- Developed a classification model and Tableau risk dashboard.
- Impact
- 0.847 ROC-AUC with high-risk customers prioritized.

Reporting Automation
Automated ETL Pipeline & Reporting System
- Challenge
- Manual preparation created long delays and recurring data errors.
- Approach
- Automated data cleaning, validation, transformation, and reporting.
- Impact
- 98% faster preparation and 90% fewer recurring errors.
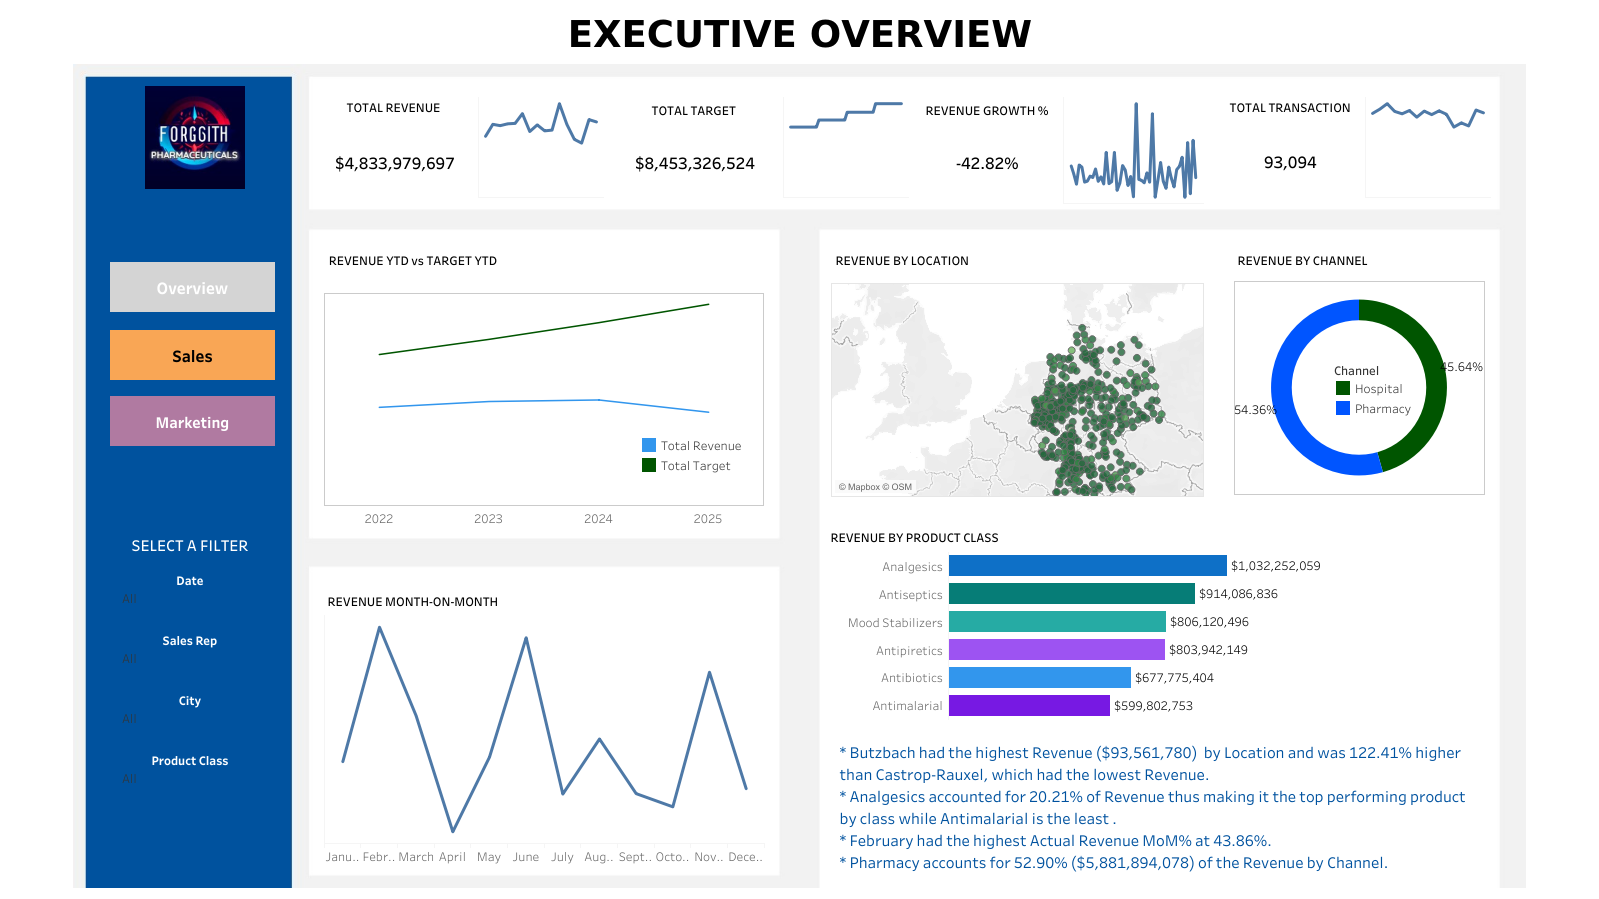
Database Design
SQL Database Design
- Challenge
- Operational booking data required a structured relational model.
- Approach
- Designed normalized tables, integrity constraints, and analytical queries.
- Impact
- Improved data integrity, reliability, and query readiness.
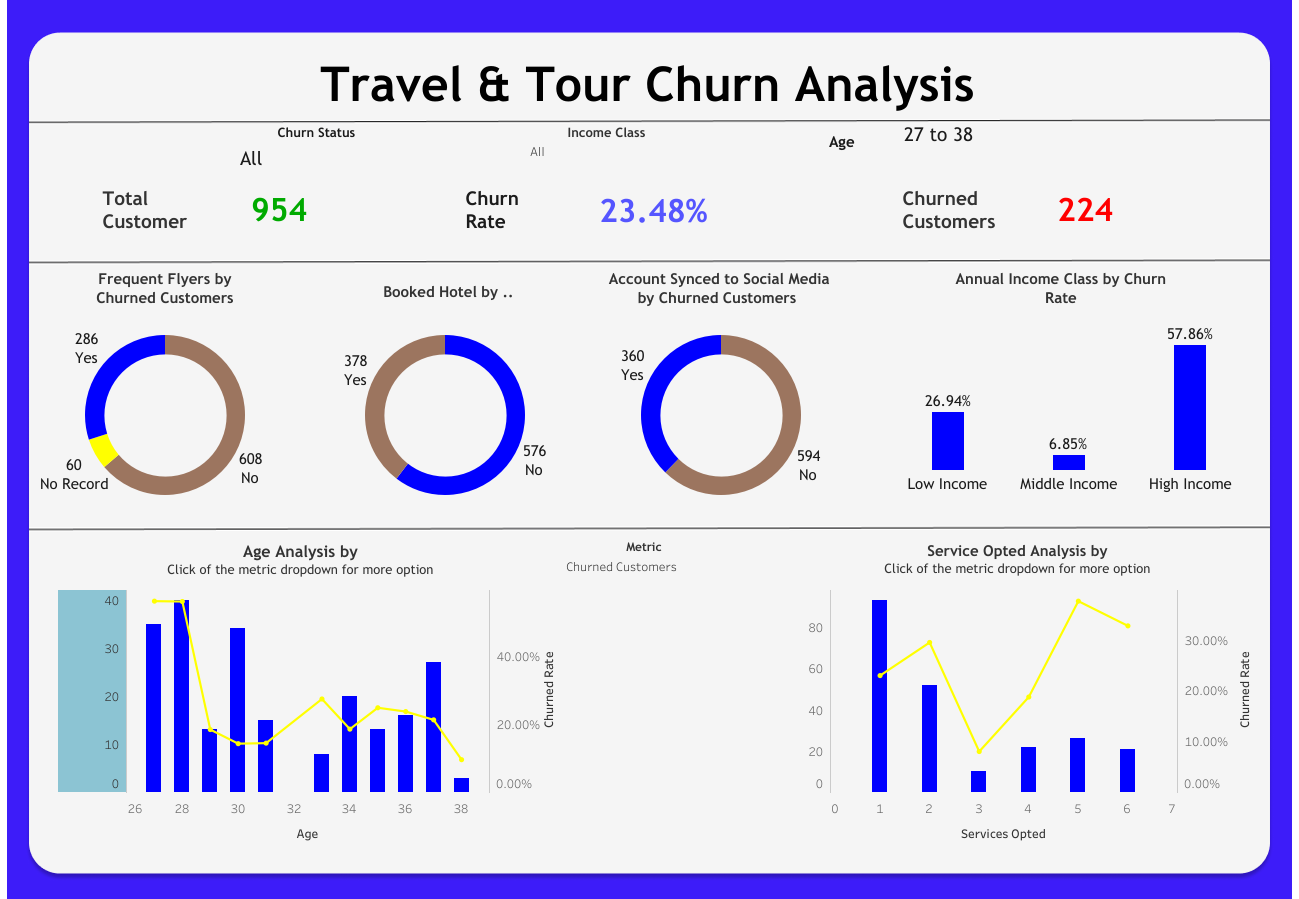
SaaS Analytics
SaaS Business Health Dashboard
- Challenge
- Leadership lacked a unified view of growth, churn, and segment economics.
- Approach
- Connected MRR, retention, churn, and customer segment performance.
- Impact
- Translated business health into a practical 90-day roadmap.
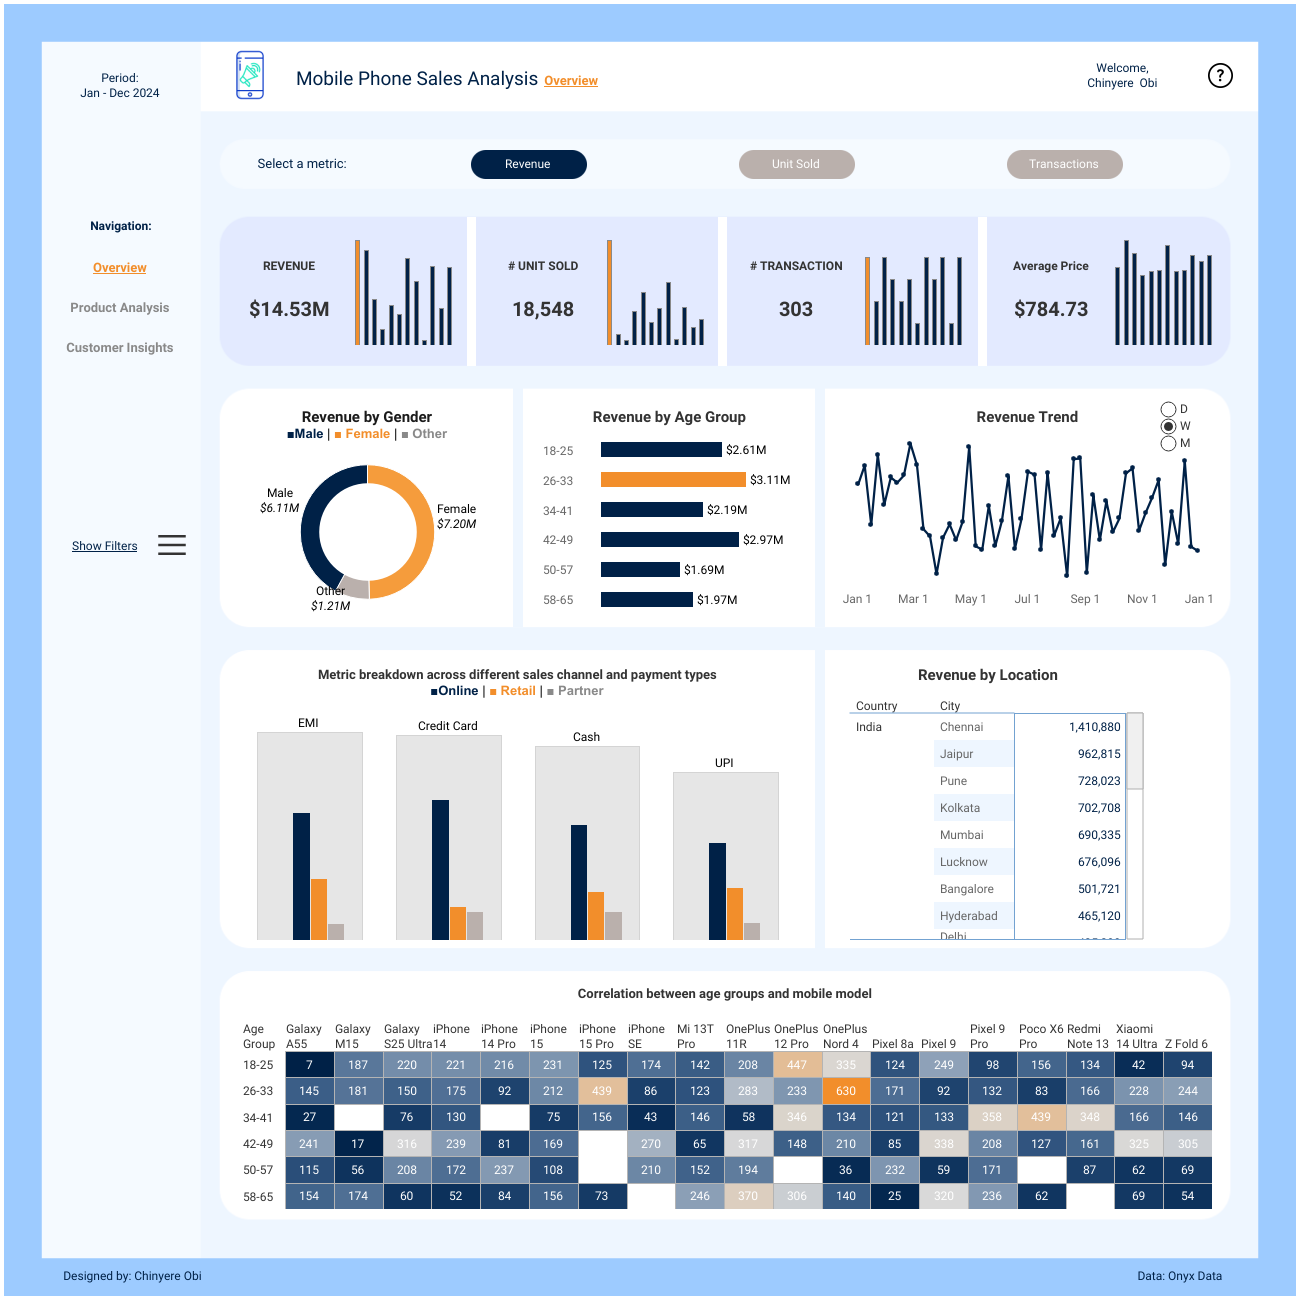
Healthcare Analytics
Healthcare Analytics
- Challenge
- Patient, hospital, diagnostic, and cost data were difficult to interpret together.
- Approach
- Built a dashboard covering outcomes, utilization, and treatment cost.
- Impact
- Analysed 55,500 patients across 10 hospitals.
Contact
Let’s discuss your analytics needs
Available for data analysis, BI, Tableau development, reporting automation, and data storytelling opportunities.
Availability
Nigeria · GMT+1 · Remote-ready
Full-timeContractFreelanceRemote
Professional Profiles
Phone
Typically responds within 24 hours.