Mobile Phone Sales Analysis

The Challenge
Sales leadership needed a consolidated view of mobile phone performance across brands, products, customer segments, and geographies. Existing reports were siloed and static, making it difficult to:
- Understand revenue drivers by brand, model, and customer demographics
- Identify high-value customer segments and repeat purchase behavior
- Track performance trends across time, locations, and sales channels
- Support data-driven decisions on pricing, inventory allocation, and market expansion
What I Built
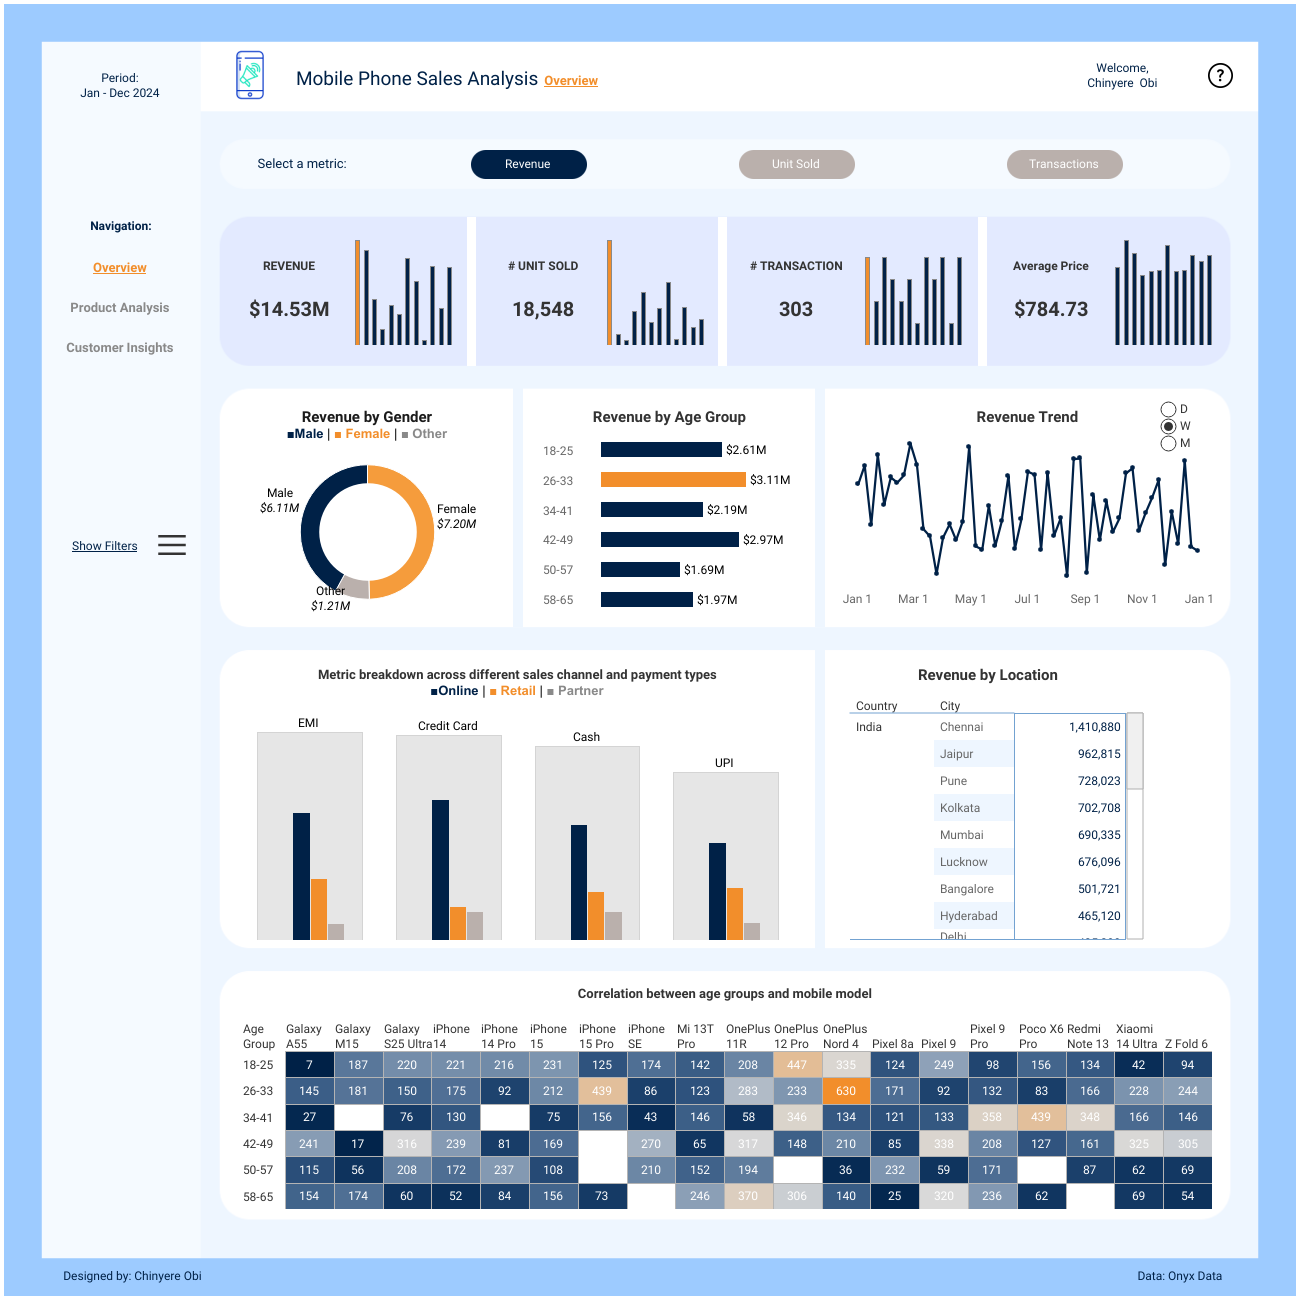
I designed and built a multi-page interactive Tableau dashboard covering Overview, Product Analysis, and Customer Insights.
1. Data Modeling & Preparation
- Cleaned and structured sales data in Excel for analytics readiness
- Created calculated fields for KPIs including revenue, average price, units sold, transactions, and CLV buckets
- Built age bands, revenue segments, and purchase behavior classifications (new vs repeat)
2. Dashboard Design & Analytics
- Developed KPI cards for Revenue ($14.53M), Units Sold (18,548), Transactions (303), and Average Price ($784.73)
- Built trend analysis with daily, weekly, and monthly views
- Analyzed revenue by gender, age group, brand, storage size, operating system, device color, and mobile model
- Implemented customer segmentation by revenue contribution and units sold
- Designed heat maps showing correlation between age groups and mobile models
- Enabled interactive filters for time period, metric selection, product attributes, and geography
3. Customer & Product Insights
- Evaluated new vs repeat purchase behavior across months
- Analyzed CLV by age band to identify high-value customer segments
- Built hierarchical product views (OS → Storage → Color → Brand → Model) for deep-dive analysis
Business Impact
Delivered a single source of truth for sales, product, and customer performance across 2024. Enabled stakeholders to quickly identify:
- Top-performing brands and models (iPhone and Samsung leading revenue contribution)
- High-value customer segments by age group and CLV
- Geographic revenue hotspots to prioritize market focus
- Repeat purchase trends, supporting retention and loyalty strategies
Improved decision-making speed by replacing static reports with interactive, self-service analytics. Provided actionable insights to support pricing strategy, inventory optimization, and targeted marketing.
Dashboard Structure
The solution consists of a three-page Tableau dashboard:
- Overview – KPIs, sales trends, revenue breakdown by brand and geography
- Product Analysis – brand performance, price analysis, storage and OS comparisons, color preferences
- Customer Insights – demographic analysis, purchase behavior, CLV segmentation, repeat vs new customer patterns
- Overview Interactive sales analytics dashboard providing comprehensive analysis of mobile device performance across brands, customer segments, and markets. Designed to support data-driven decisions for sales leadership and market strategists.
- Technologies Used Tableau Desktop (Interactive Dashboard), Microsoft Excel (Data Preparation), Calculated Fields, Data Modeling
- Skills Demonstrated Sales & customer analytics · Tableau dashboard design · KPI development · Data modeling · Customer segmentation · Trend analysis · Product performance analysis · Data storytelling · Analytics UX design
- Business Impact Enabled sales stakeholders to monitor brand performance, identify high-value customer segments, and optimize pricing and inventory strategies through centralized, interactive analytics.