Crime Analysis in Washington D.C.
-
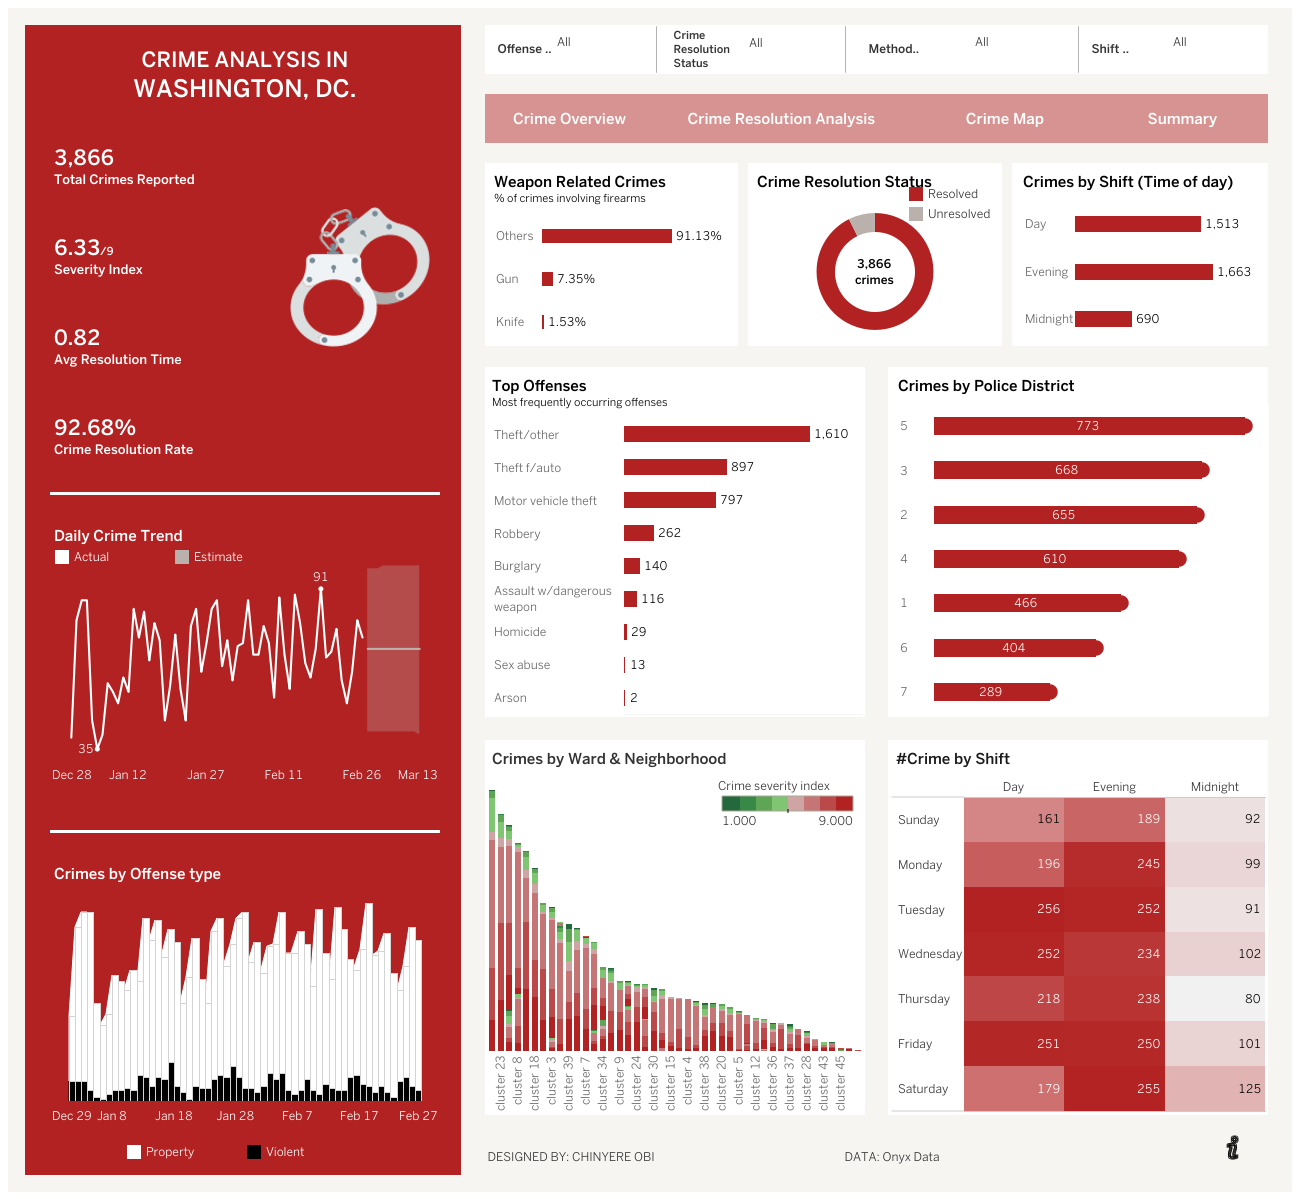
Overview: This dashboard explores crime statistics in Washington D.C., providing a data-driven view of public safety trends by offense type, time, and location.
- Visualizations: Heatmaps, bar charts, and time-series graphs to show crime frequency, locations, and daily trends.
- Insights Delivered: Identified high-crime areas and peak crime hours; analyzed most common offense types; Offered insights into seasonal and temporal patterns in crime rates.
- Tool: Tableau
- Skills demonstrated: Public safety analytics, geospatial analysis, time-series visualization, data-driven storytelling with Tableau.
🔗 Explore the Interactive Dashboard